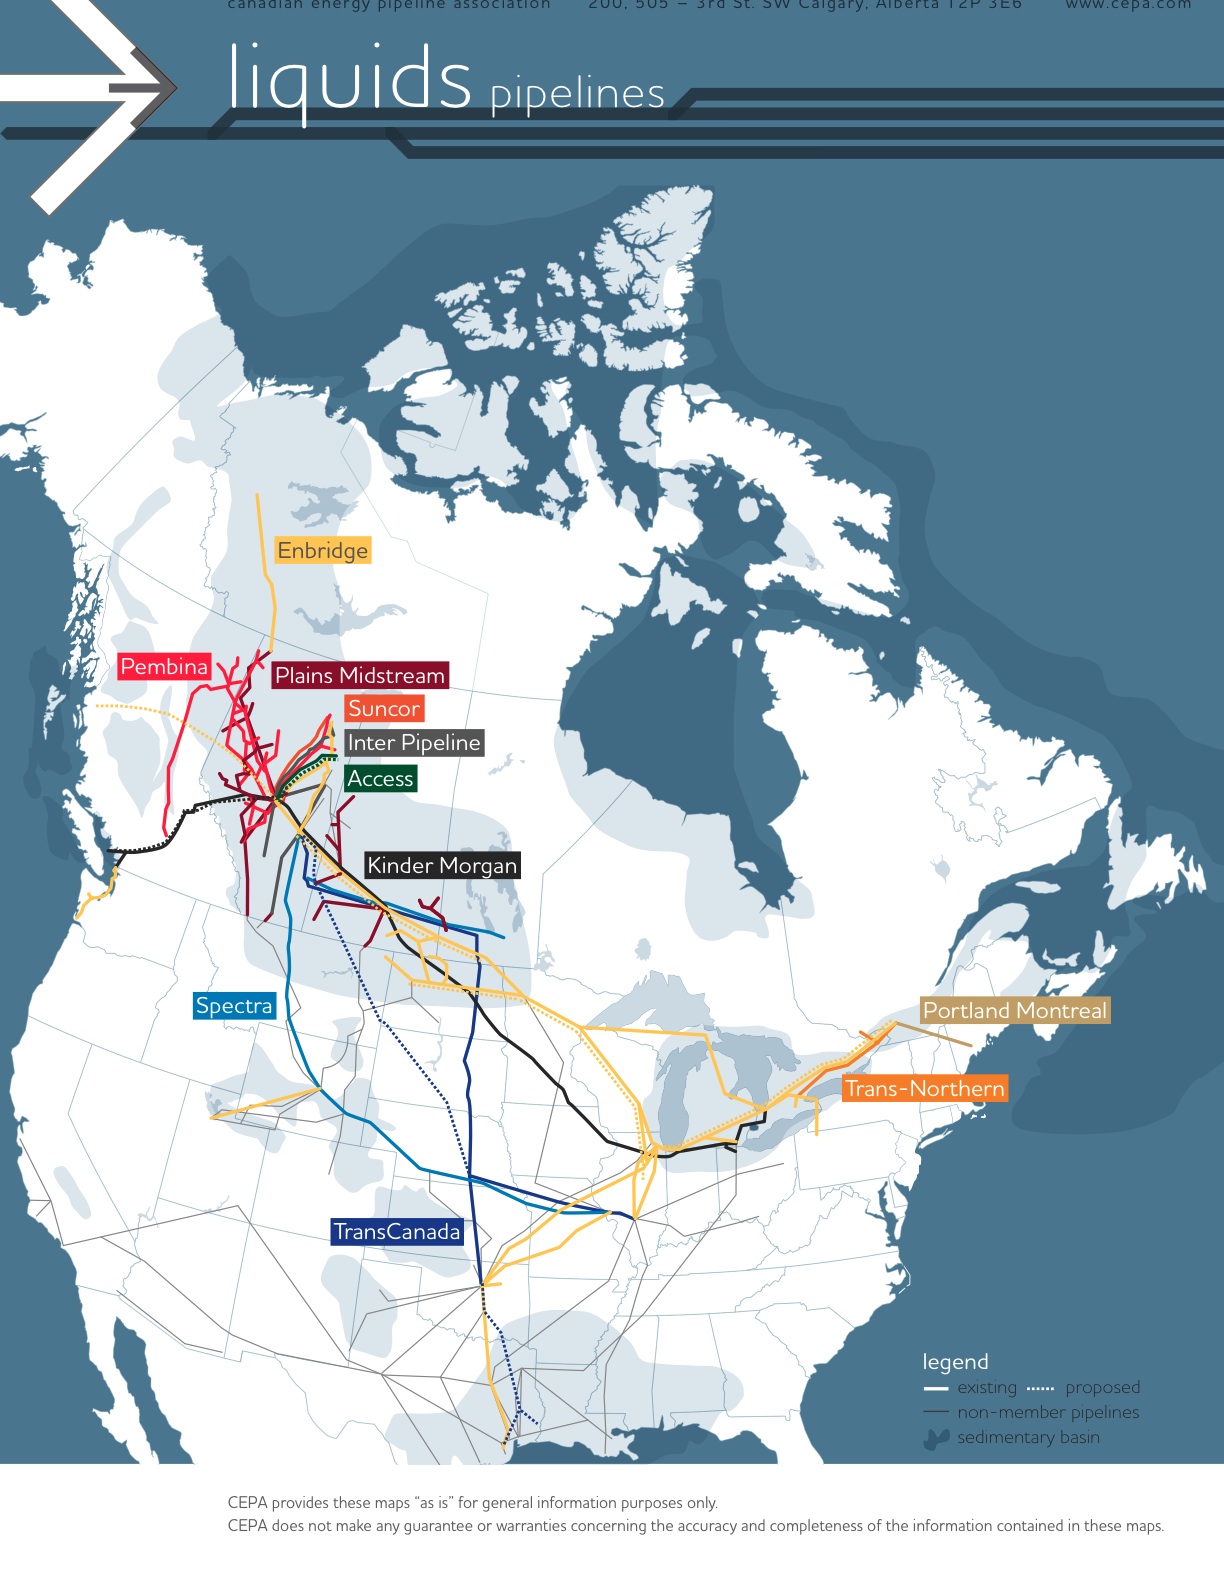
A neat, interactive set of maps from the Canadian Energy Pipeline Association can be found here. This is a very useful tool for keeping the discussions around pipeline routes, reversals and new proposals straight. I’ve posted a couple of quick maps I made below (click to enlarge them), but you can select for several variables for each of natural gas or liquids (i.e. by company, proposed, under construction, existing).
Interactive Pipeline Maps: Liquids, Natural Gas + Proposed LNG Plants
February 12, 2013 by 2 Comments
The maps don’t provide any indication about the size of pipe shown on the map. These are just a few of the major routes and the actual pipeline density would only show up on a township level map.
The interactive maps are useful to the public but also deceitful in not reporting the real length, age or density of pipe in Alberta.
Carl
Carl,
I think your comment is spot on. I think these maps are helpful only in broad strokes. They are a neat tool for those less familiar with pipelines in general but, as you point out, there is a great deal lost in just what is represented and what is not. These sorts of issues are the case with any map and my thanks to you for initiating this line of thinking with these ones. I’d be curious to see other mappings of pipelines and to hear more about your thoughts on this.
Jeremy